Debug on Esp Open Rtos with GDB stub
One thing that Esp didn’t have yet is a proper debug tool. The objective of this tutorial is showing how to make a proper debug based on Espressif and Vlad Ivanov (resetnow) tools.
First steps
Esp Open Rtos GDBStub installation
In order to install GDB stub you have to follow the instructions from Esp GDBStub in github.
Clone repository.
sudo git clone https://github.com/resetnow/esp-gdbstubYou have to install premake5. I haven’t found it in the Linux repositories so I have downloaded from here and put in the same folder as the project.
After that you have to run Premake5 that will create a make file. –with-eor flag must point to Esp Open Rtos installation folder.
premake5 gmake --with-eor=/home/workspace/esp-open-rtosProject configuration
I am going to use basic blink project from Esp Open Rtos example. In this project you have Makefile file.
PROGRAM=blink

# Add this line to add gdbstub library.
# This could change based on your project location

EXTRA_CFLAGS+=-I../../esp-gdbstub/include
EXTRA_LDFLAGS+=-L../../esp-gdbstub/lib

include ../../common.mk

# Add this line to add gdbstub library.
LIBS+=esp-gdbstub
After that you have to configure the library inside the blink.c project.
#include <stdlib.h>
#include "espressif/esp_common.h"
#include "esp/uart.h"
#include "FreeRTOS.h"
#include "task.h"
#include "esp8266.h"

// Added to add gdbstub support
#include "gdbstub.h"

const int gpio = 2;

void blinkenTask(void *pvParameters)
{
    gpio_enable(gpio, GPIO_OUTPUT);
    while(1) {
        gdbstub_do_break();
        gpio_write(gpio, 1);
        vTaskDelay(1000 / portTICK_PERIOD_MS);
        gpio_write(gpio, 0);
        vTaskDelay(1000 / portTICK_PERIOD_MS);
    }
}

void user_init(void)
{
    uart_set_baud(0, 115200);
    // Added to add gdbstub configuration
    // It must be done after uart configuration
    gdbstub_init();

    xTaskCreate(blinkenTask, "blinkenTask", 256, NULL, 2, NULL);
}
Based on Ivanov notes:
- Note that upon launching the debug session gdb will send “continue” command if the target is paused at gdbstub_do_break. If you want to stop right after debug session launch, place gdbstub_do_break macro twice in your code.
- Using software breakpoints (‘br’) only works on code that’s in RAM. Code in flash can only have a hardware breakpoint (‘hbr’). If you know where you want to break before downloading the program to the target, you can use gdbstub_do_break() macro as much as you want.
- Due to hardware limitations, only one hardware breakpoint and one hardware watchpoint are available.
Eclipse configuration
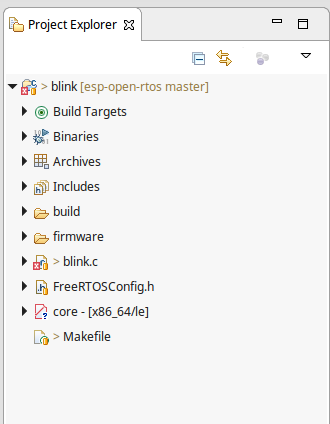
If you want you can import the project example inside Rtos folder in Eclipse. I am using: Eclipse IDE for C/C++ Developers. Version: Neon.1a Release (4.6.1). In order to do that: File -> Import -> Existng Code as Makefile Project and go to your Blink project.
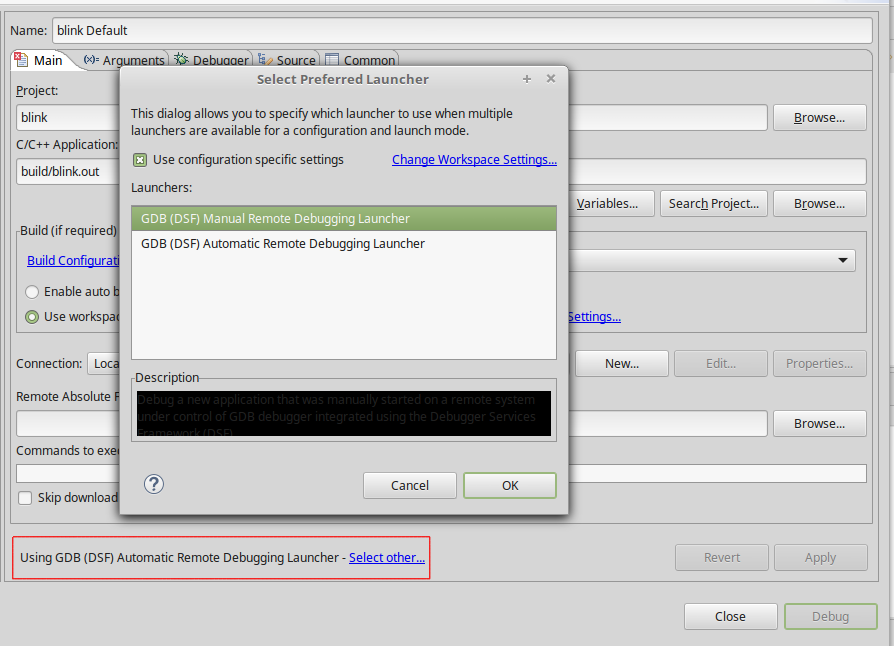
After that to configure the project go to: Debug configurations -> Rigth over C/C++ Remote Application -> New . Click at the bottom of the window on “Select other…” and choose “Use configuration specific settings” -> “GDB (DSF) Manual Remote Debugging Launcher”.
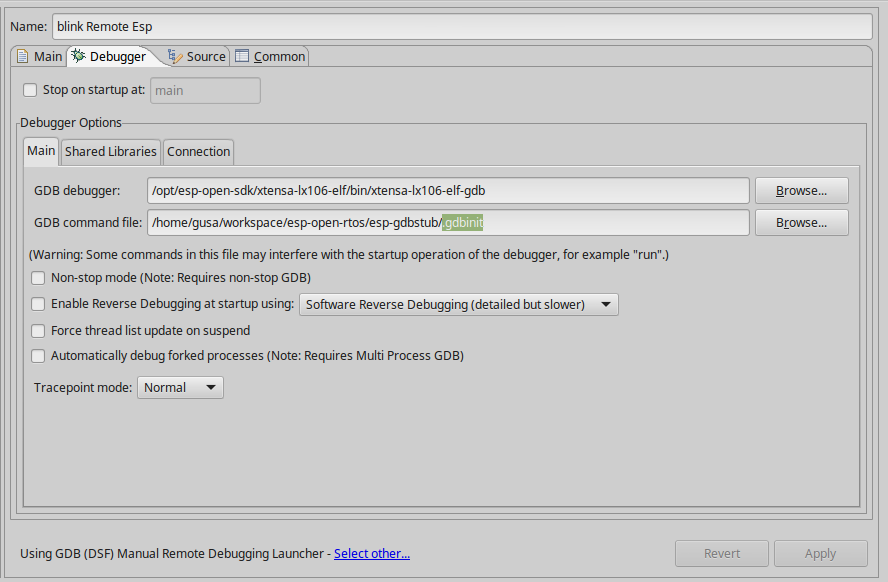
In the debugger tab unselect “Stop on startup at:”.
In the main tab select “GDB debugger” and “GDB command line file”. GDB debugger must point to the path where is the Esp debugger in my case: “/opt/esp-open-sdk/xtensa-lx106-elf/bin/xtensa-lx106-elf-gdb” and GDB command must point to the .gdbinit file you downloaded from the Esp GDBStub in github.
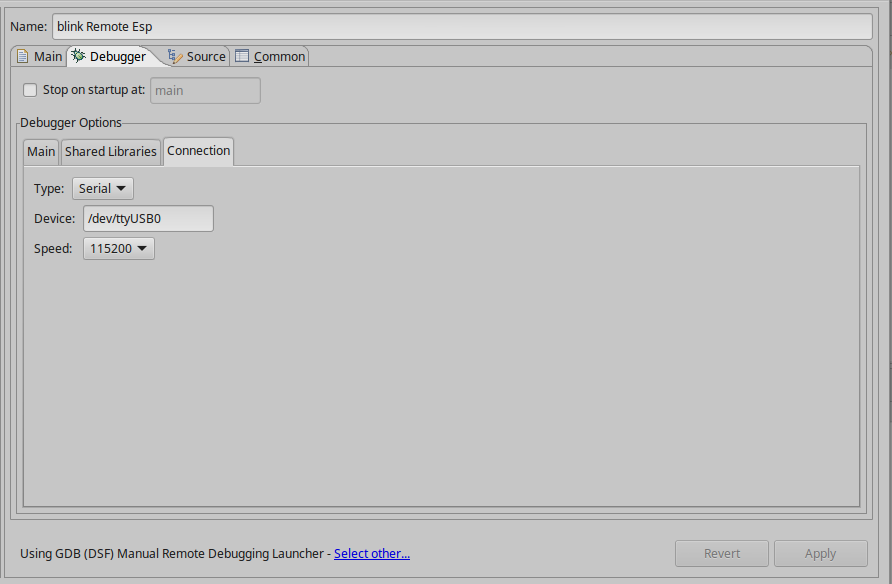
Finally you have to set up the serial port in the Connection tap.